
AirPeak Switzerland Free on the App Store · Get
Hourly Swiss pollen & air quality · iPhone & iPad

Know your air.
Then climb above it.

AirPeak turns the official Swiss pollen and air-pollution networks into one personal respiratory risk score - and shows you which mountain is clear today, with the train that gets you there.
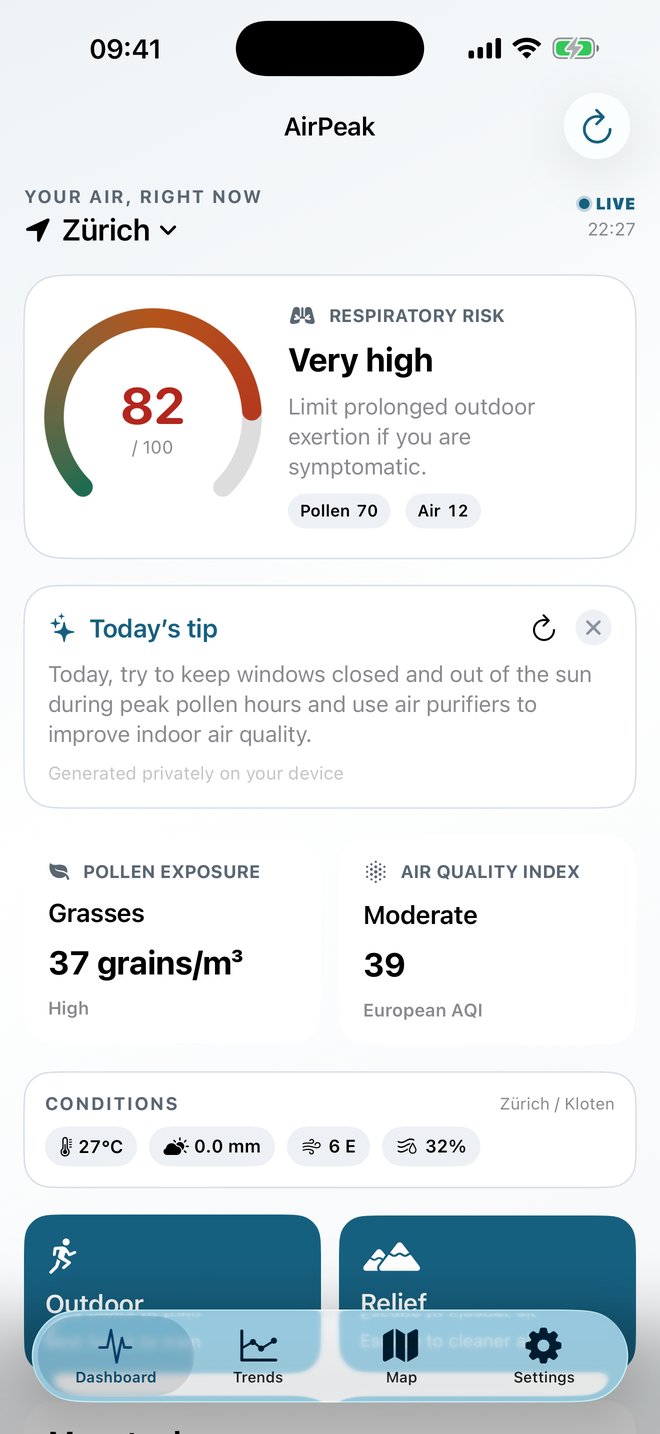
AirPeak dashboard for Zürich: respiratory risk 82 out of 100, grasses 37 grains per cubic metre, air quality index 39
Respiratory risk
82/ 100
Very high
Grasses
37grains/m³
Your trigger · high
European AQI
39
Moderate
Pilatus Kulm · 2,049 m
~2.9grains/m³
Cleanest air today
01Above the
inversion

Pollen thins with height. AirPeak tells you how much.

Drag the line up the mountain. This is the same two-stage altitude model the app runs on your station's live measurement - slow decline through the valley air, then a sharp drop above the inversion edge.

559 m a.s.l.
Est. grasses
37.0 grains/m³
vs. valley station
±0 %
Where that is
Zürich station

Example: 37 grains/m³ of grass pollen measured at a 559 m station. Mountain values are estimates derived from the station measurement - the app always labels them as modeled, not measured, and real conditions can differ.

02What's
inside

Measure. Decide. Understand.

Fifteen tools in three plain groups. Select any line to see the screen.

A - Measure
B - Decide
B4Laundry advisorWhether today is safe to hang washing outside.
C - Understand
C4Report for your doctorA PDF summary of exposure, symptoms and medication.
C5Allergy cardYour triggers and medication as a card with a QR code.
C6AlertsA notification before your pollen crosses your threshold.
AirPeak screen: Dashboard
03The risk
score

One number, and you can see how it's made.

The respiratory risk score runs from 0 to 100. Nothing about it is hidden.

Weighted by your triggers

Official grain counts count for more when the species is one you react to, scaled by the sensitivity you set.

Pollution included

Ozone, NO₂, PM10 and PM2.5 from the federal NABEL network, expressed as a European AQI.

Five plain levels

From very low to very high, always with a sentence telling you what to do about it.

04Where the
numbers
come from

Federal measurements, not forecasts from somewhere else.

AirPeak reads Swiss open government data directly. Live values can be delayed or preliminary, and the app says so when they are.

Pollen

MeteoSwiss

The automatic pollen monitoring network, station by station.

HOURLY · MEASURED
Air pollution

FOEN / BAFU NABEL

Particulates, ozone and nitrogen dioxide from the national network.

HOURLY · MEASURED
Elevation

swisstopo

Heights for stations and suggested destinations, feeding the altitude model.

HEIGHT API · MODELED ABOVE STATION
Getting there

SBB

A timetable link from where you are to the clearest summit.

DEEP LINK · NO ACCOUNT
05Privacy

Health data that stays where your health is.

No account, no tracking, no server of ours holding your diary.
Symptom diary, triggers, medication
Stored on your device. Synced only through your own iCloud, and only if you switch that on.
Today's tip
Generated privately on your device.
Location
Used to find your nearest station. “While using the app” is enough.
Your data, your file
Export everything as JSON or CSV from Settings whenever you like.

Read the privacy policy →

06On every
screen

Glance at it. Ask for it. Spread it out.

  • WidgetsCurrent pollen, European AQI and a mountain-relief suggestion on your Home Screen.
  • Siri & ShortcutsAsk for your risk, log a symptom, check the laundry verdict or your next season.
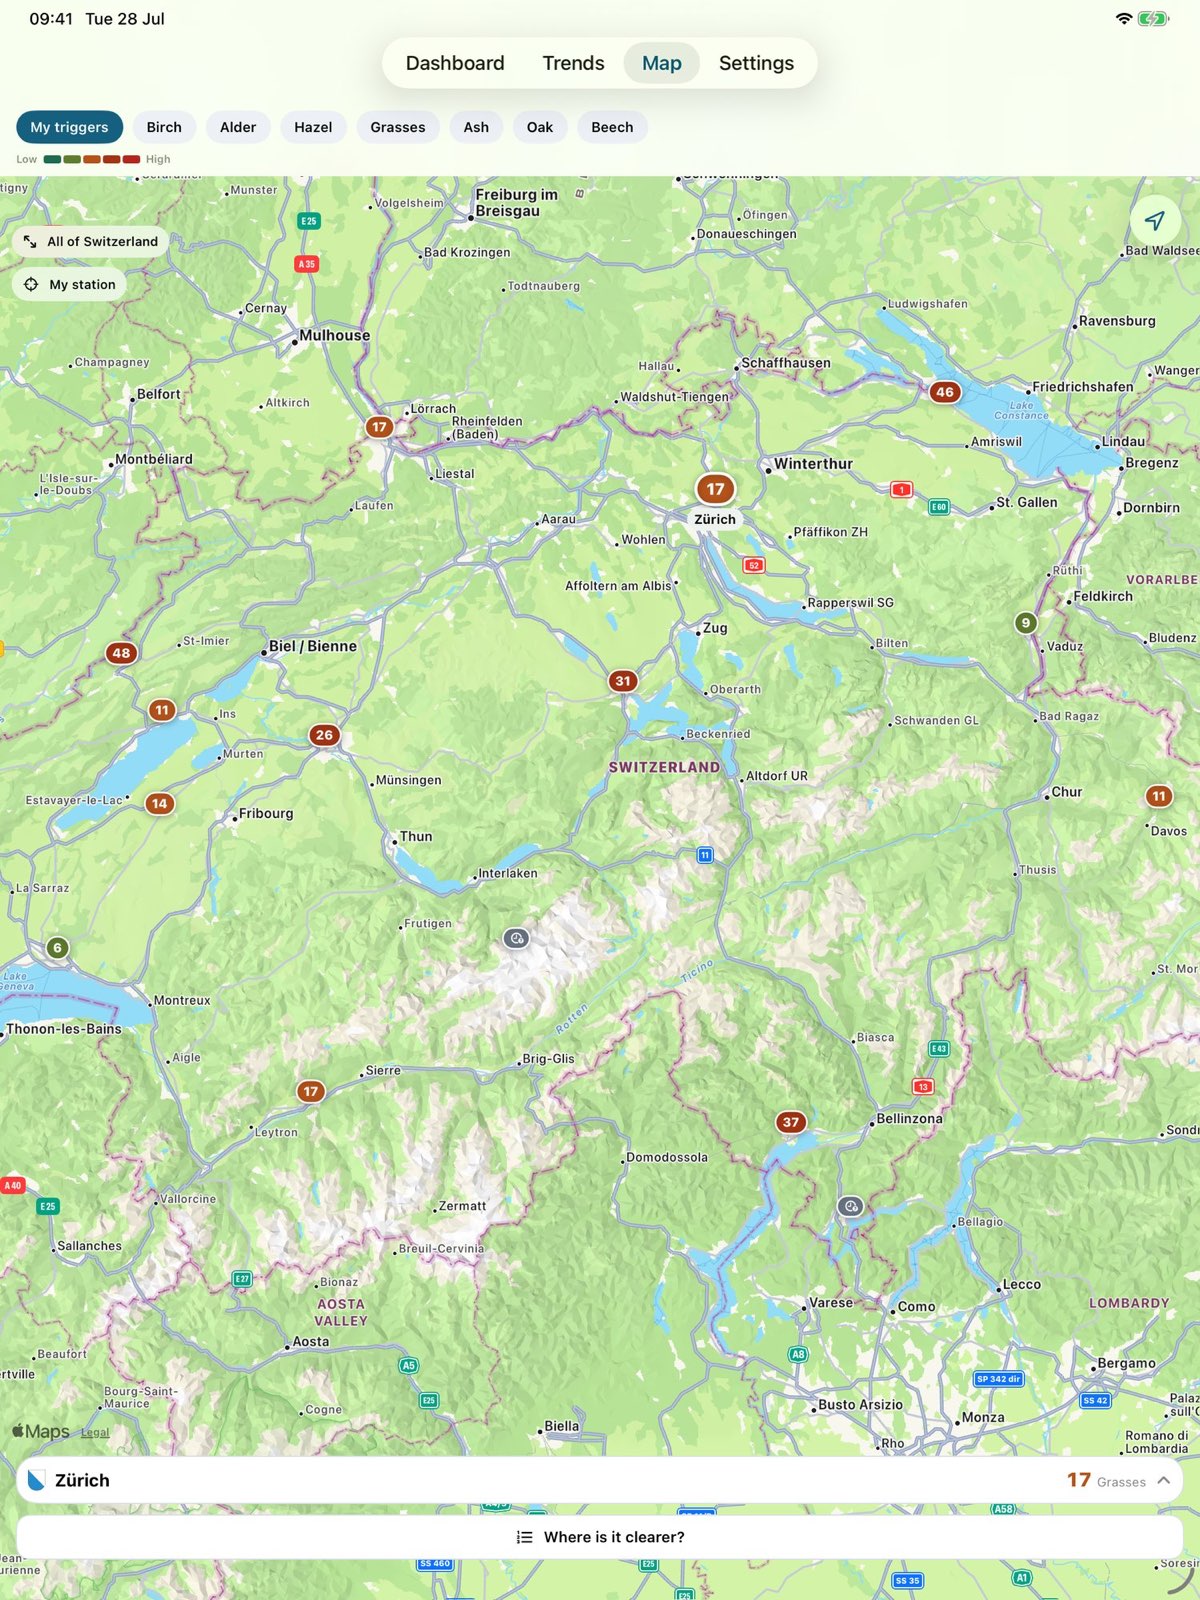
  • iPadThe whole country on one map, with station detail alongside.
  • OfflineYour last readings and history stay available without a connection.
  • LanguagesDEFRITEN
AirPeak on iPad: a map of Switzerland with pollen readings at each station
AirPeak app icon: a snow-capped peak with a Swiss flag above a leaf and a wave of air

Breathe easier this season.

Download on theApp Store Free · Version 1.1 · iOS 18 or later