 AirPeak Switzerland
MeteoSwiss
The automatic pollen monitoring network, station by station.
HOURLY · MEASURED
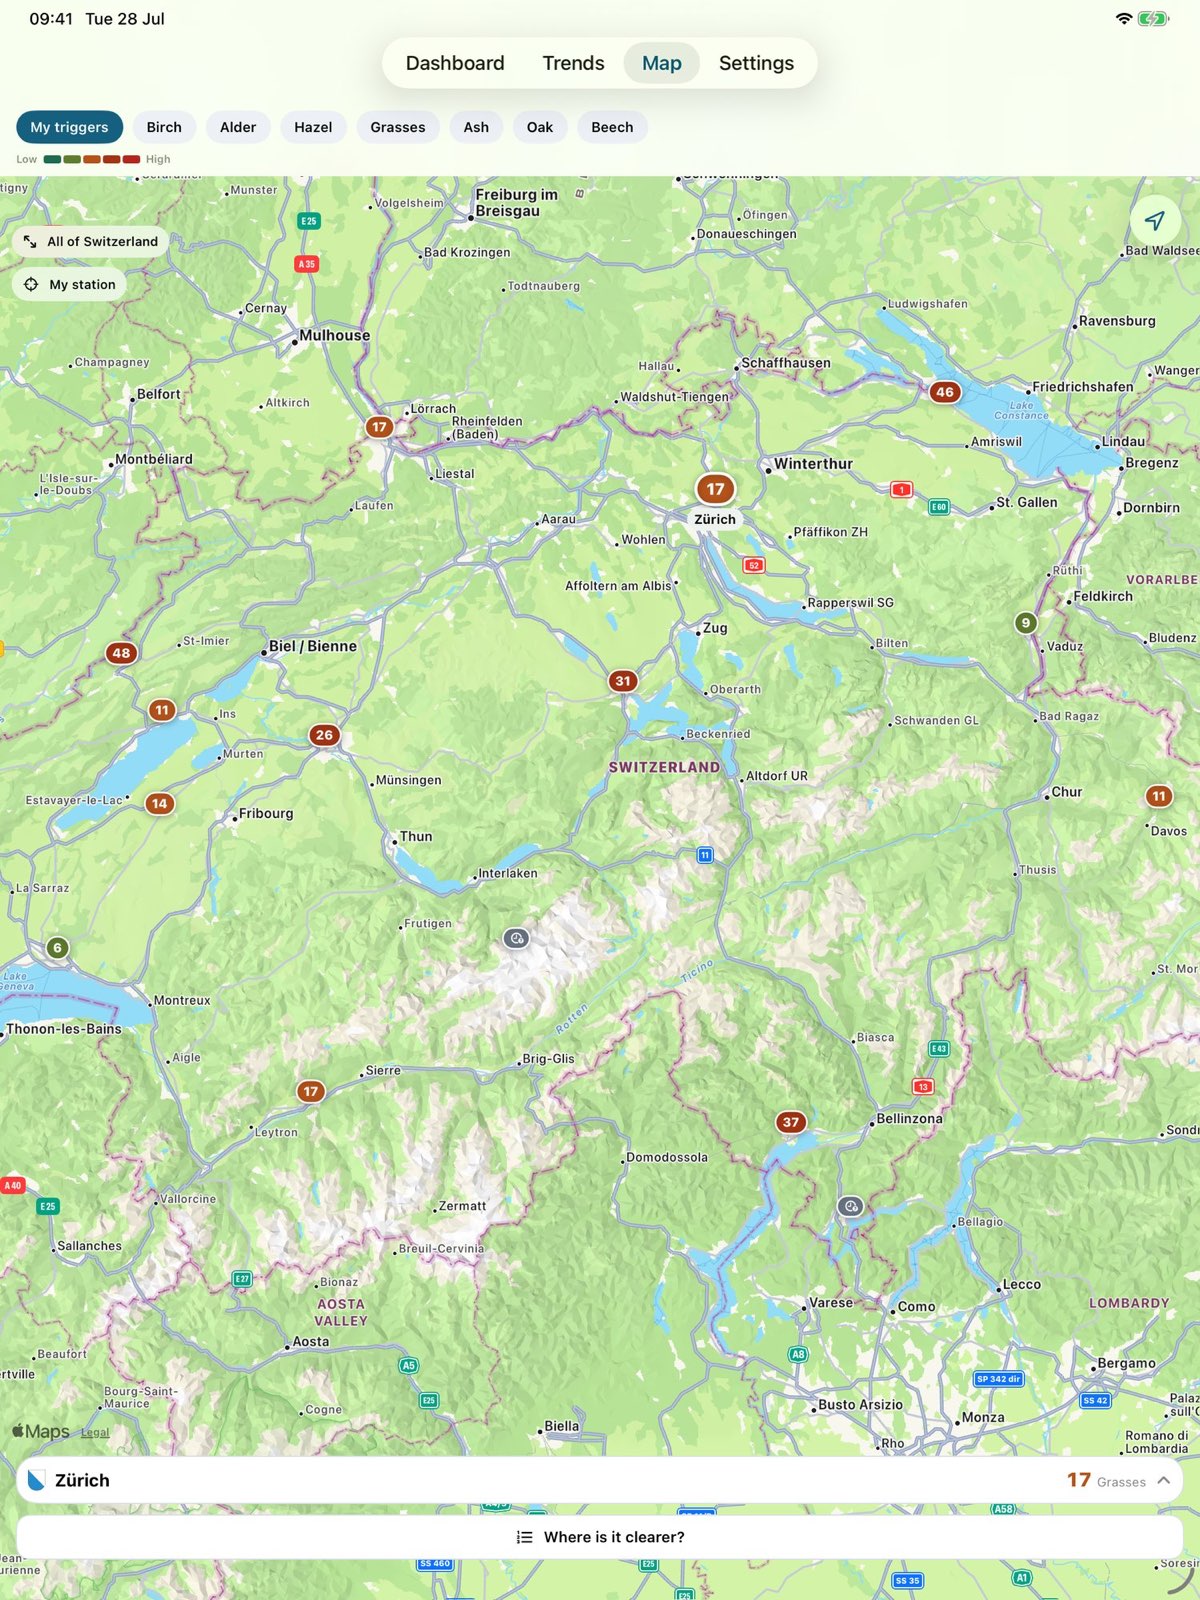
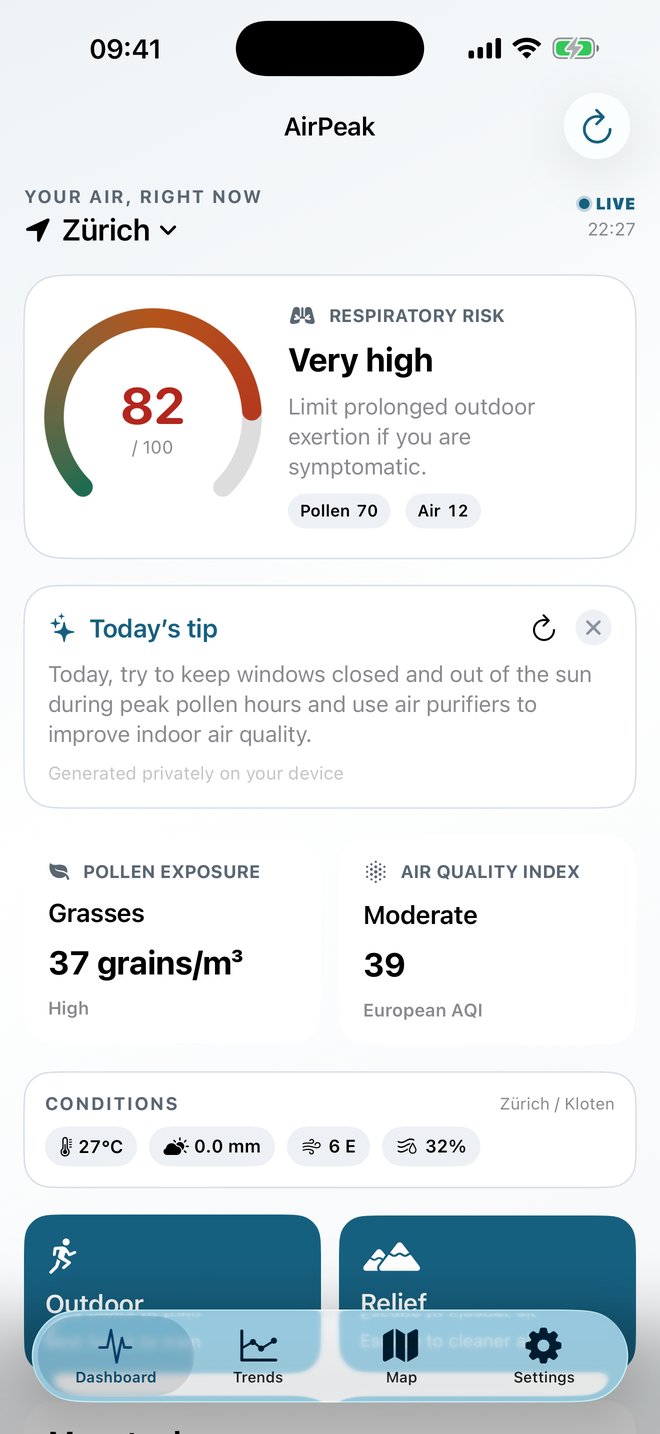
AirPeak turns the official Swiss pollen and air-pollution networks into one personal respiratory risk score - and shows you which mountain is clear today, with the train that gets you there.
Drag the line up the mountain. This is the same two-stage altitude model the app runs on your station's live measurement - slow decline through the valley air, then a sharp drop above the inversion edge.
Example: 37 grains/m³ of grass pollen measured at a 559 m station. Mountain values are estimates derived from the station measurement - the app always labels them as modeled, not measured, and real conditions can differ.
Fifteen tools in three plain groups. Select any line to see the screen.
The respiratory risk score runs from 0 to 100. Nothing about it is hidden.
Official grain counts count for more when the species is one you react to, scaled by the sensitivity you set.
Ozone, NO₂, PM10 and PM2.5 from the federal NABEL network, expressed as a European AQI.
From very low to very high, always with a sentence telling you what to do about it.
AirPeak reads Swiss open government data directly. Live values can be delayed or preliminary, and the app says so when they are.
The automatic pollen monitoring network, station by station.
Particulates, ozone and nitrogen dioxide from the national network.
Heights for stations and suggested destinations, feeding the altitude model.
A timetable link from where you are to the clearest summit.
No account, no tracking, no server of ours holding your diary.